Ten Numbers on One Page: A Dashboard for the Plant Head
You cannot manage what you do not measure. These ten metrics, reviewed weekly, give an honest picture of how a plant is performing.
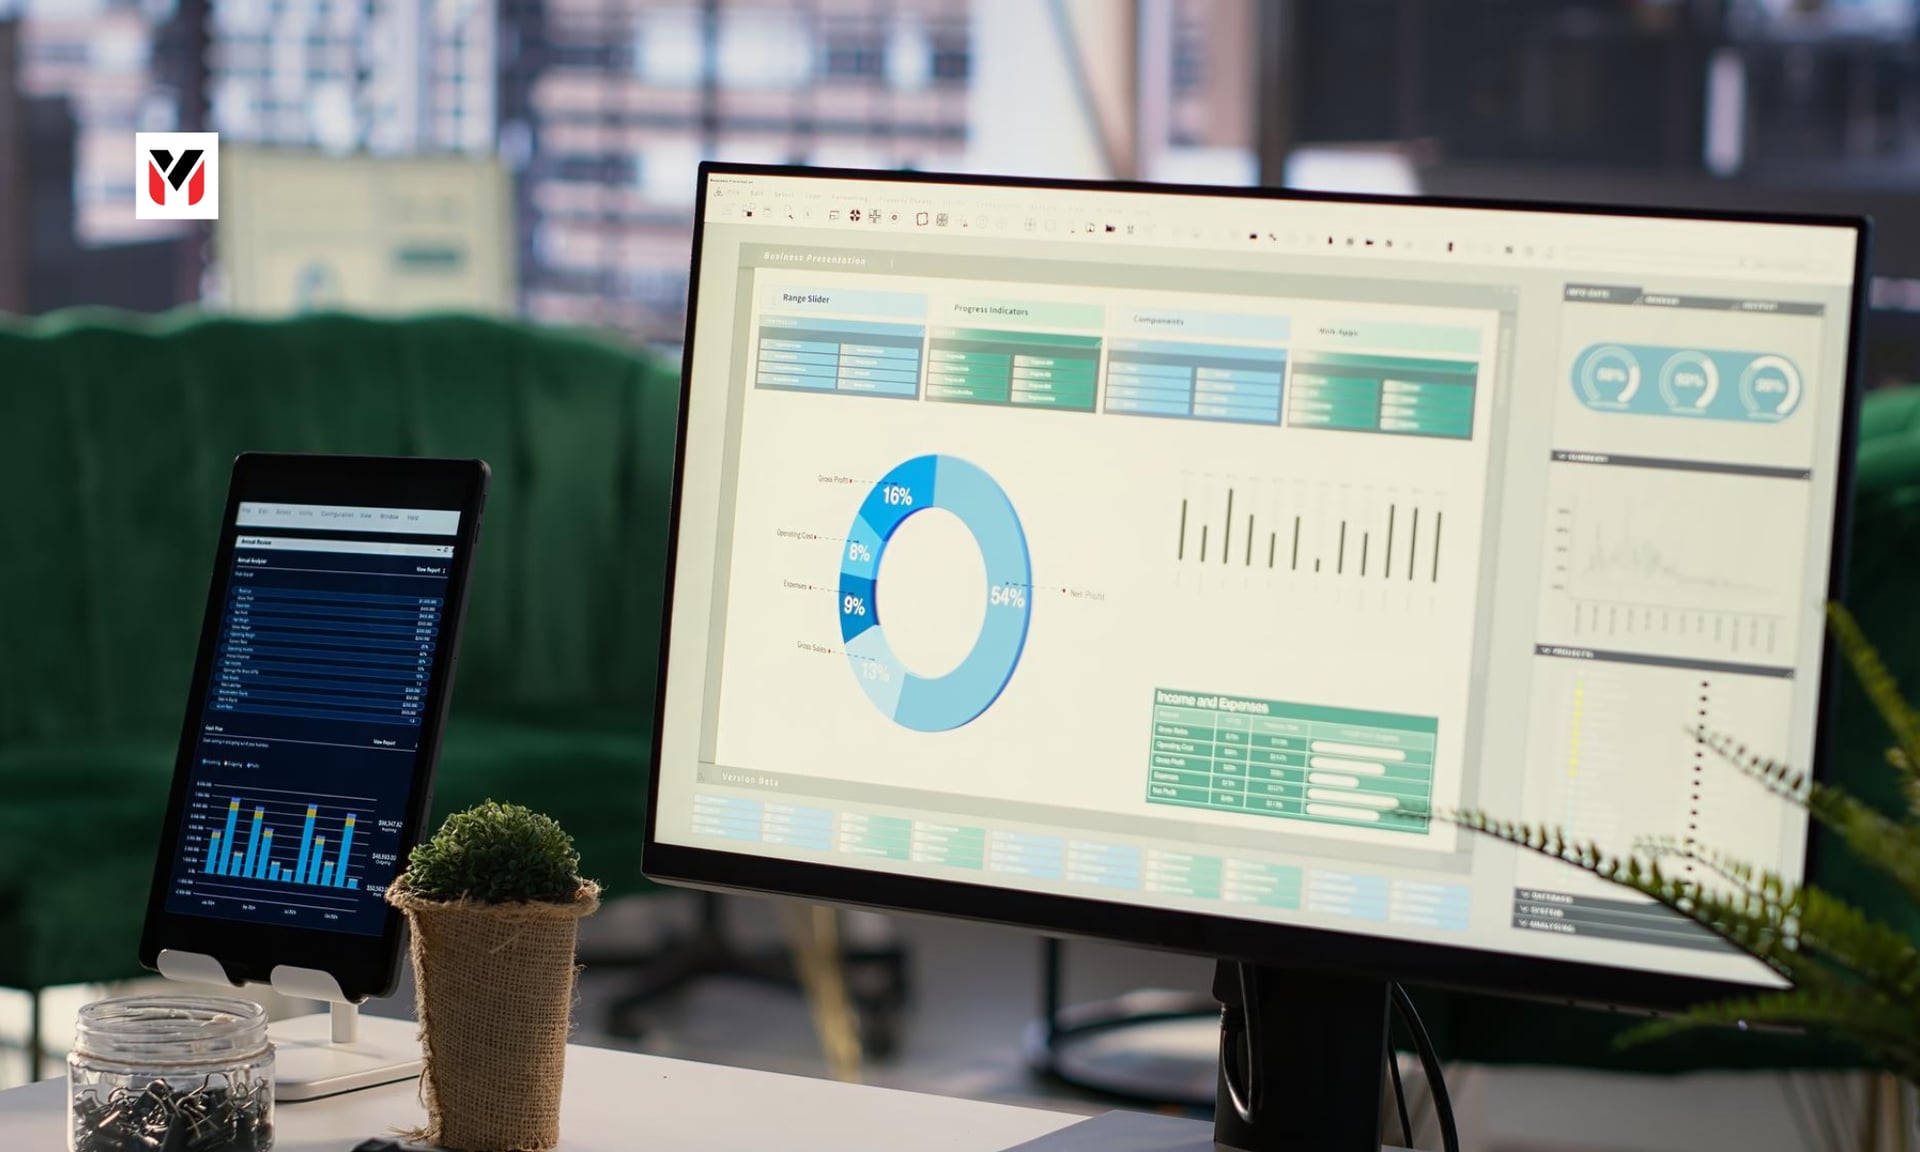
A clipboard with ten gauges arranged in a grid in charcoal and red palette · Editorial · Analysis preview.
Official Benchmarks: RBI, Logistics & PMI
Official data gives managers a few reference points. The Reserve Bank of India surveys manufacturers on order books, inventories and capacity utilisation; its release of 1 July 2026 announced the 74th round, covering April to June 2026 (Q1 2026-27), with the findings to be published later and no figure in the announcement.
The DPIIT-NCAER study put national logistics cost at 7.97% of GDP in 2023-24, and found that firms with turnover under Rs 5 crore spend about 17% of output value on logistics, against about 7.6% for large firms.
The PMI gives a monthly view of orders, output, hiring, stock and prices. These are not targets for your plant, but they show what is measured and why.
This dashboard is our editorial framework. Adapt the definitions to your industry, and agree them with your finance team before you start.
The Ten Metrics (1 to 5: Operations & Delivery)
1. Capacity utilisation. Actual output divided by the maximum you could produce with current equipment and shifts. It shows how much room you have to take on new orders. RBI's survey measures this for the sector, so you can compare directional trends once published.
2. Order book cover. Value of confirmed orders divided by average monthly sales. It tells you how many months of work are secured.
3. On-time delivery. Share of orders delivered by the promised date. Customers judge you on this above almost anything else.
4. First-pass yield. Share of units that pass inspection the first time. Rework and scrap are hidden costs.
5. Overall equipment effectiveness. A combined measure of availability, speed and quality for key machines. Even a rough version shows where time is lost.
“The best dashboard is the one people actually read on Monday morning.”
The Ten Metrics (6 to 10: Inventory, Cost & People)
6. Inventory days. Raw materials, work in progress and finished goods, expressed in days of sales or usage. Rising days tie up cash.
7. Logistics cost as a share of sales. Add all freight, warehousing, packing and handling costs, then divide by sales. Compare with the 17% and 7.6% reference points above, bearing in mind that your product may differ.
8. Input cost index. Track the price of your five biggest inputs against a base month. It shows early where margins will be squeezed.
9. Cash conversion cycle. Inventory days plus receivable days minus payable days. A shorter cycle means less money needed to run the business.
10. Safety and absenteeism. Incidents, near misses and absence rates. They predict problems before output falls.
How to Use the Dashboard & A Hypothetical Bottleneck
• Keep it to one page. If it takes more than five minutes to read, people stop reading it. • Review weekly in a fixed meeting. Start with the red items. Ask for an owner and a date for each. • Show trends, not just numbers. A line over twelve weeks tells more than a single value. • Define each metric once. Disputes about what counts waste time. • Link it to money. For each metric, estimate what one point of improvement is worth. That focuses attention.
An example, hypothetical: Imagine a casting plant whose dashboard shows capacity utilisation at 85%, on-time delivery slipping to 88% and inventory days rising. Instead of buying a new machine, the team investigates and finds that a single heat-treatment step is the bottleneck, and that stock is building because finished parts wait there. A change of shift pattern at that step, not new capital, restores flow. This is an illustration of how the dashboard points to causes, not a case we have reported.
Limits, Starting Four & Monday Implementation
Limits: Metrics can be gamed. A team judged on utilisation may build stock nobody wants. Balance the set so that no one number can be improved at the expense of the others. Treat the dashboard as a conversation tool, not a scorecard to punish.
What to start with: If ten feels too many, begin with four: on-time delivery, first-pass yield, inventory days and logistics cost as a share of sales. Add the rest as the habit settles.
Our reading: A plant that reviews a few honest numbers every week will usually outperform one with an elaborate system nobody reads. The aim is to see problems when they are small.
Getting started this week: Pick one product line, not the whole plant. Gather four weeks of data for the first four metrics, using whatever records exist. Present them at a short meeting and ask what surprised people. The first version will be imperfect, and that is fine. Improving the data is part of the process, and teams usually find that the act of measuring changes behaviour before anything else does.
Editorial framework; benchmarks cited are from the RBI release (1 July 2026) and Outlook Business's report on the DPIIT-NCAER study (25 Sept 2025).
- Reserve Bank of India, press release on the 74th round of the OBICUS survey, 1 July 2026
- Outlook Business, 25 Sept 2025 (DPIIT-NCAER logistics cost study)
- Angel One, 1 Oct 2026 (PMI)
The Editorial Desk
Perspectives on the people, ideas and businesses shaping what comes next. The articles in this preview are illustrative samples, not reported journalism.
More from the Editorial Desk