Eight Sectors, the Same Few Addresses: How Concentrated Is India's Growth?
National totals suggest breadth. The distribution inside them points to a handful of cities, airports, states and firms carrying much of the weight.
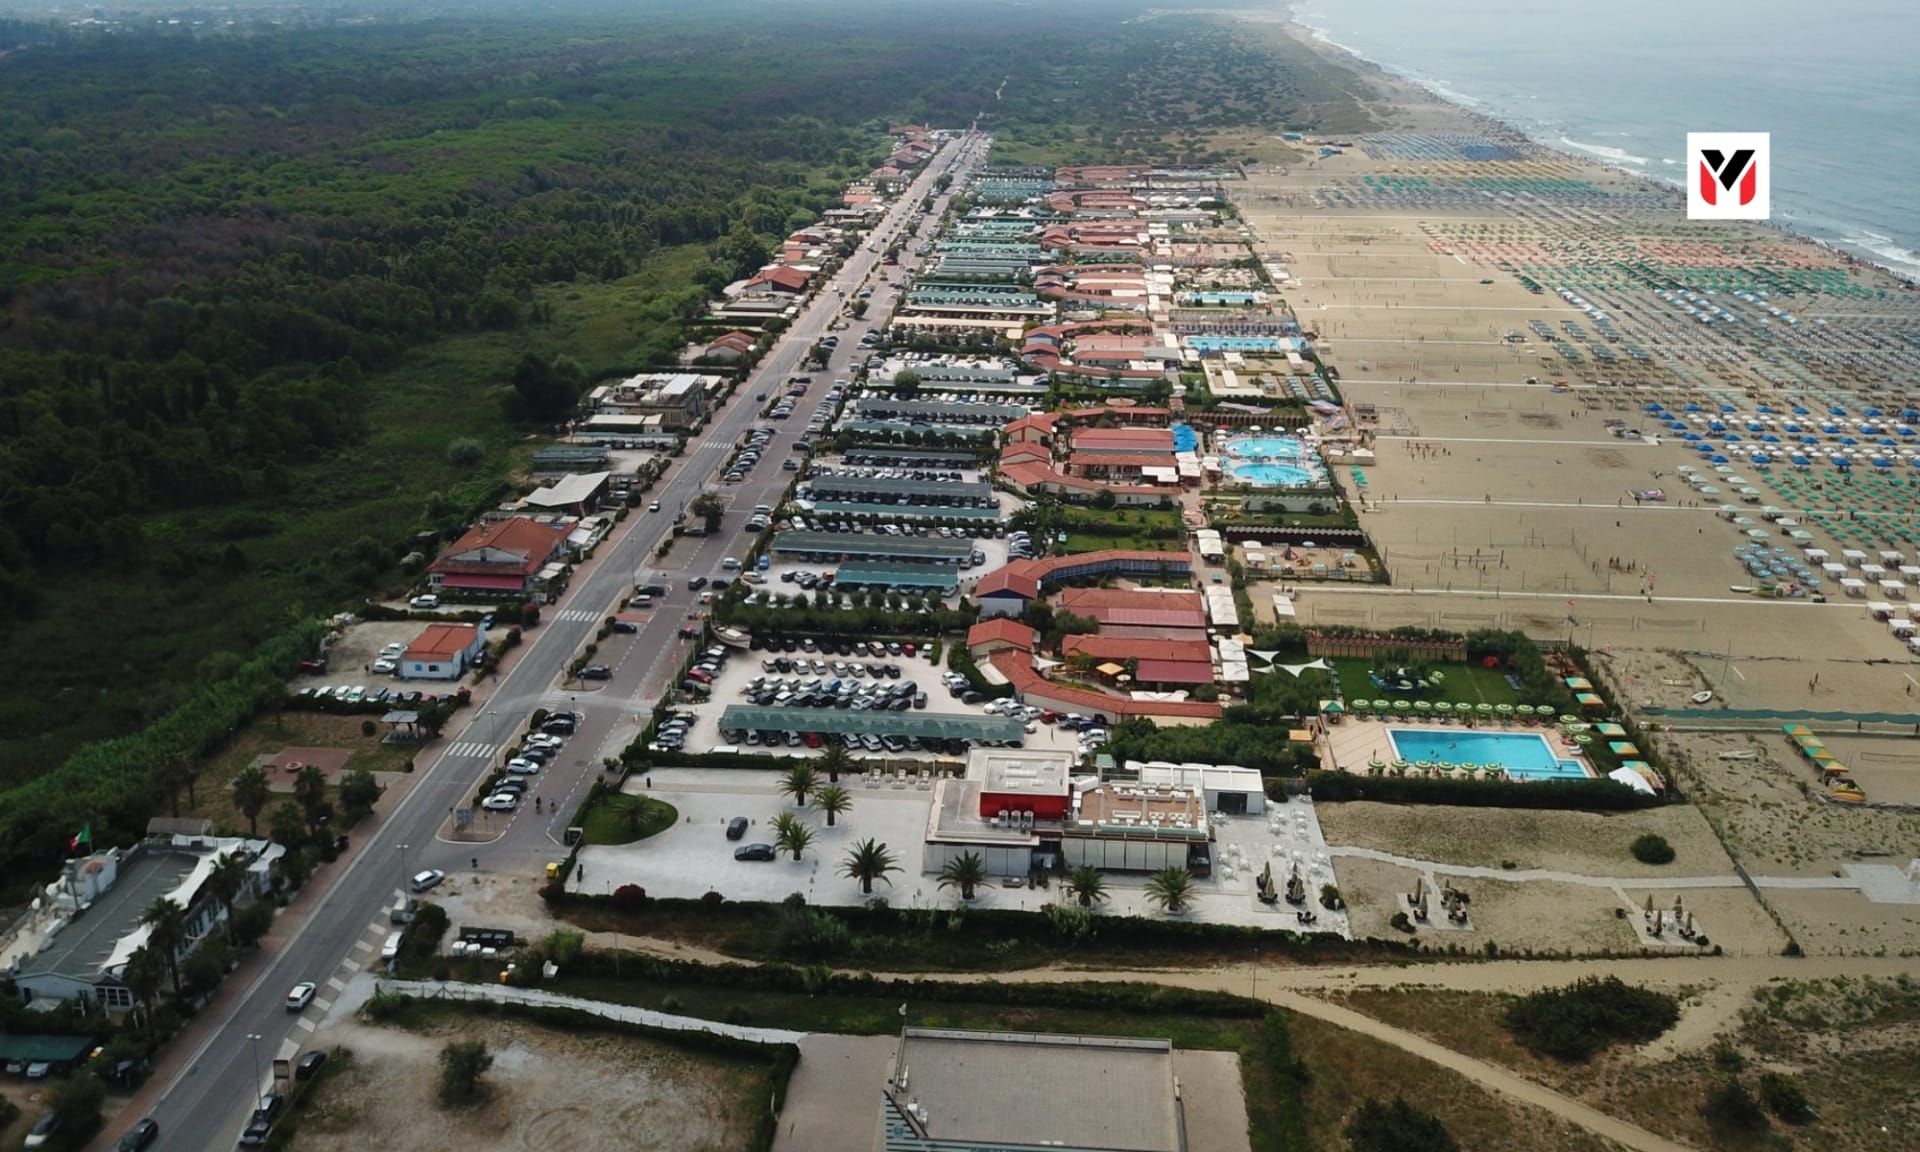
Sector geographic concentration across Indian cities analysis illustration · Editorial preview.
Introduction
A national total says how much. It does not say where. When we look inside the numbers collected for this series, one pattern recurs: a small number of places and companies account for a large share of the activity. This piece assembles the evidence and asks what it implies. The firms and periods differ, so the shares are not additive across sectors and the comparison is about pattern, not magnitude.
Sector Evidence: Offices, Homes, Warehouses, Tourism, and Storage
Offices: CBRE reported that Hyderabad, Bengaluru and Delhi NCR together accounted for 69% of Q3 2026 office leasing. On supply, CBRE said Hyderabad, Bengaluru and Pune accounted for about 89% of Q3 completions. Cushman & Wakefield put Bengaluru at 43% and Hyderabad at 38% of its Q3 completions, 81% together. For occupiers, Cushman & Wakefield said GCCs took about 65% of leasing in both Bengaluru and Pune.
Homes: Anarock said the Mumbai Metropolitan Region and Bengaluru together made up 48% of Q3 housing sales in the top seven cities. On launches, the MMR led with about 37,500 units and Hyderabad followed with about 18,950, which means those two cities accounted for about 56,450 of 1,14,320 launches, or roughly 49%, by our addition.
Warehouses: Colliers said Delhi NCR and Chennai together accounted for over 45% of H1 2026 Grade A leasing, and Delhi NCR and Mumbai for over 40% of new completions. Third-party logistics firms took 30% of leasing.
Foreign tourism: The Ministry of Tourism's April 2026 snapshot showed that Delhi took 39.2% of foreign tourist arrivals by port of entry, Mumbai 18.5%, Bengaluru 8.8%, Chennai 8.6% and Hyderabad 4.0%. Those five airports account for 79.1% by our addition. The top five source countries accounted for about 43.7%.
Domestic tourism: The Policy Edge, summarising the Ministry's 2026 compendium, said Uttar Pradesh accounted for about 68% of the national rise in domestic visits in 2025, a count that includes the Kumbh Mela.
Storage contracts: IEEFA reported that three firms won about 64% of the roughly 920 MW of storage awarded in April to June 2026. Awards were down about 78% year on year, and a single delayed pumped-hydro tender of 16.4 GW accounts for much of the gap between tendered and awarded pumped hydro.
“A national average describes few actual buildings.”
Implications of Geographic and Corporate Clustering
What the pattern implies: 1. Efficiency and fragility are the same thing. Concentration brings agglomeration benefits: talent, suppliers and customers in one place. It also means a local shock, a policy change or a single customer's decision has an outsized effect. 2. Averages mislead. A national office vacancy of 14.37% describes few actual buildings. A national rise in housing sales of 3% describes a market where four of seven cities fell. 3. Infrastructure follows demand, and strains it. If five airports take 79% of foreign arrivals, those airports need capacity and the other regions need reasons to attract visitors. 4. Dependence on events. A single festival or event can drive a state's yearly total.
The counter-view: Concentration is not necessarily a failing. Economies of scale and clustering are real, and capital goes where returns are highest. Some of the pattern may reflect where infrastructure, universities and ports already are. A policy to spread activity would have costs, and our sources do not allow us to assess them.
The Concentration Checklist: Our Framework
A concentration check for readers: our framework: Before relying on any national figure, ask: 1. How many places account for half of it? 2. Is one event, customer or firm decisive? 3. Does the average describe a typical case or a few large ones? 4. What would happen if the leader's share fell by a quarter?
Actionable Guidance for Businesses and Policymakers
What it means for businesses: A business that depends on one city or one customer should plan for a shock to it. A business entering a market should compare the leading city with the emerging ones, where costs and competition differ.
What it means for policymakers: Regional data are more informative than national totals. Publishing city and district breakdowns routinely would help investors and planners.
How to use this in practice: If you run a business that sells to offices, homes or travellers, build two views of your market: the national total, which tells you the weather, and the top five cities or airports, which tell you where the customers are. Review both each quarter. If your own sales are concentrated in the same places as the market, your risk is the market's risk; if they are not, ask why.
What we do not know: We do not know whether concentration is rising or falling in any of these markets, because our sources give single periods. We have not compared shares over time.
Status flag: Synthesis of figures from Cushman & Wakefield, CBRE, Colliers, Anarock (Business Today), the Ministry of Tourism (via The Policy Edge and its April snapshot) and IEEFA. Different firms use different city sets and periods; shares should not be added across sectors.
- CBRE, India Office Figures Q3 2026; Cushman & Wakefield Q3 2026 (IANS via DT Next, 10 October 2026).
- Business Today, Anarock Q3 2026 housing data, 29 September 2026.
- The Tribune, Colliers India warehousing release, 16 July 2026.
- Ministry of Tourism, Monthly Tourism Snapshot, April 2026; The Policy Edge, 28 September 2026.
- IEEFA, India energy storage key findings (data as of June 2026).
- Our analysis, arithmetic and framework are original to MediaVault Global Magazine.
The Editorial Desk
Perspectives on the people, ideas and businesses shaping what comes next. The articles in this preview are illustrative samples, not reported journalism.
More from the Editorial Desk