A Domestic Boom and a Foreign Dip: What the 2025 Tourism Data Really Say
Domestic tourism recorded a 45.5% rise, foreign arrivals fell 8.1%. One number measures trips inside states; the other measures people crossing the border.

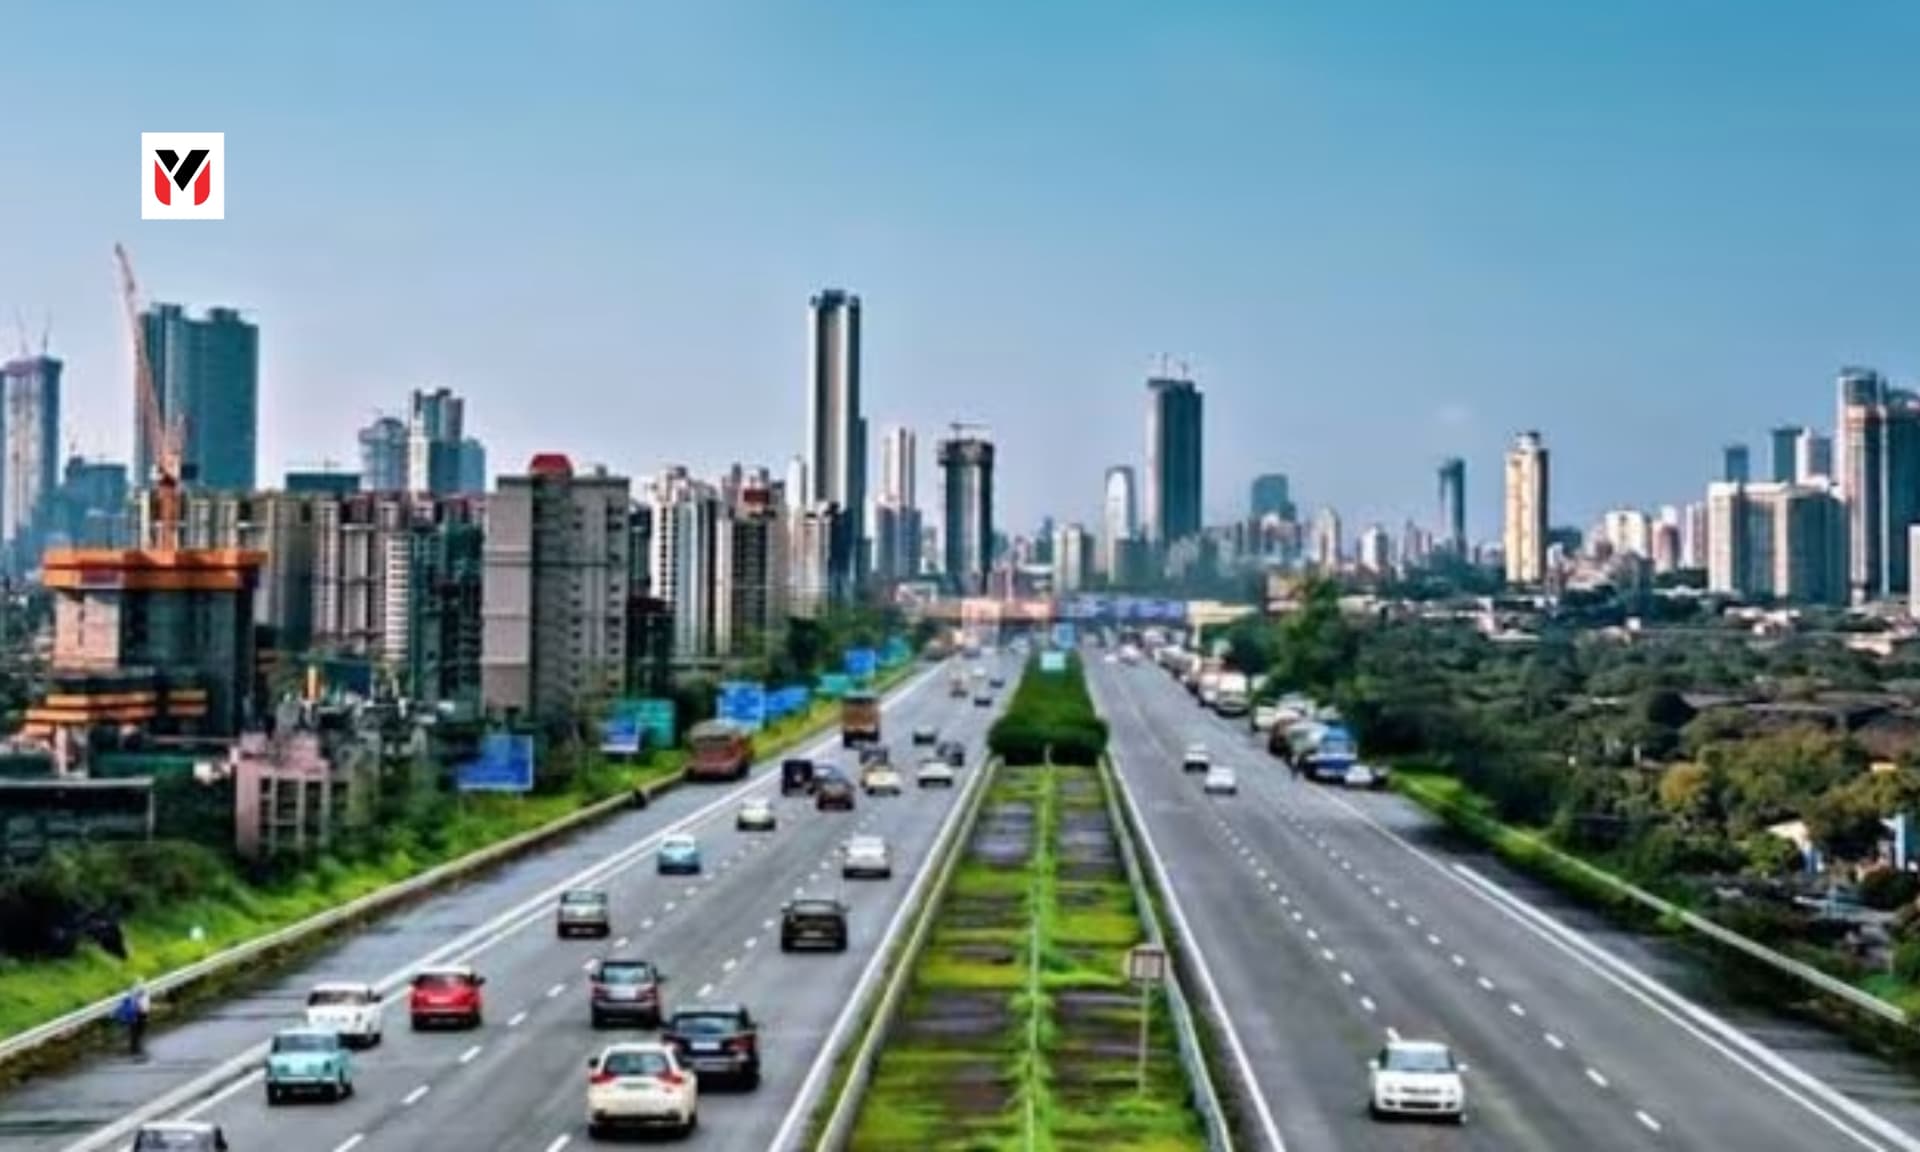
Domestic pilgrimage ghat and airport arrivals split-frame illustration · Editorial preview.
The 2025 Figures & Reconciling the Apparent Contradiction
The Ministry of Tourism's India Tourism Data Compendium 2026, as summarised by The Policy Edge on 28 September 2026, reports travel flows for calendar year 2025. We read the summary, not the compendium, and we report its figures with their caveats.
The figures: • Domestic tourist visits to states and union territories: 428.55 crore, up 45.5% from 2024. • Foreign tourist arrivals in India: 91.49 lakh, down 8.1% from 99.52 lakh. • Tourism foreign-exchange earnings: US$31.69 billion, down 9.5%. • Foreign tourist visits to states and union territories: 2.53 crore, up 21.6%. • International arrivals including Indian nationals living abroad: 2.02 crore, down 1.7%. • Indian nationals' departures abroad: 3.28 crore, up 6.3%.
Why these numbers do not conflict: Foreign tourist visits to states rose 21.6% while foreign tourist arrivals in India fell 8.1%. That looks contradictory, and it is not. A "visit" to a state is counted each time a foreign tourist visits a state, so one traveller who visits three states counts three times. Arrivals count people entering the country. So visits can rise even if arrivals fall, if the average traveller visits more states. The same logic applies to domestic visits: a family travelling to three states in a year counts as three visits.
The Kumbh Mela Effect & Bangladesh Inbound Contraction
The role of Uttar Pradesh and the Kumbh: The summary said Uttar Pradesh accounted for about 68% of the national rise in domestic visits, and that its count includes the 2025 Kumbh Mela. The compendium does not isolate the Kumbh's effect. That matters for interpretation: if one extraordinary event drives most of the increase, the 45.5% rise is not a guide to underlying growth. Our arithmetic from the summary's own numbers: a 45.5% rise on a 2024 base implies about 294.5 crore domestic visits in 2024 (428.55 divided by 1.455), so the increase was about 134 crore visits, and 68% of that, about 91 crore, came from Uttar Pradesh. We caution that this assumes the summary's percentages are consistent, and it is our estimate, not the Ministry's.
The foreign decline: The summary identified a 73.2% fall in arrivals from Bangladesh as the main driver of the decline in foreign arrivals. It did not show how much of the earnings decline that explains. Our arithmetic: arrivals fell by 8.03 lakh (99.52 minus 91.49). We do not know Bangladesh's share, so we cannot compute how much of the fall it explains, and we do not try.
“A visit is not a visitor. Counting the same traveller three times is not growth.”
Outbound Flows & Accounting Methodologies
Departures: Indian nationals' departures abroad were 3.28 crore, up 6.3%. Indians travelling abroad exceed foreign arrivals by a wide margin, a point we explore in our next piece.
Different periods and methods: The summary stressed that the datasets use different reference periods and methods: travel flows and earnings are for calendar year 2025, but the gross domestic product share is from 2023-24, employment from 2024-25 and monument footfall from FY2025-26. Totals from different datasets should not be combined.
How to read tourism statistics: our guide: 1. Distinguish visits, arrivals and people. They are different units. 2. Look for a single driver. One event can dominate a total. 3. Look at the source markets. A fall in one market can mask growth elsewhere. 4. Check the period. Calendar year, financial year and monthly data differ. 5. Compare earnings with arrivals. They can move in different directions.
Worked Example & Strategic Implications
A worked example of counting (invented numbers, ours): Suppose an invented state receives 10 foreign travellers in a year. Four visit only that state, and six visit three states each. Arrivals in the country are 10 people. Visits to that state, however, are counted once for each traveller who entered it. If the following year the same 10 travellers come and two more of the single-state visitors add a second state, visits in state-level data rise, while arrivals do not change at all. The example is invented and describes no real state. It shows how a 21.6% rise in visits and an 8.1% fall in arrivals can sit in the same report without either being wrong.
What it means for hotels and operators: Domestic demand is the base of the industry. Operators that depend on foreign guests need to understand source-market risks. Those that serve domestic travellers need to plan for events and seasonal peaks that are hard to repeat.
What it means for destinations: A big event can strain infrastructure and does not guarantee a lasting rise in visitors. Local authorities need to plan for capacity.
Essential Questions Before Quoting Headlines
What to ask before quoting a tourism headline: Ask whether the number counts people, trips or visits; whether it covers a calendar year or a financial year; and whether one event or one market dominates the change. A journalist, an analyst or an operator who asks these three questions will avoid most of the mistakes that appear in tourism coverage.
What we do not know: We do not know the Kumbh's contribution, the Bangladesh share of arrivals, or how the earnings figure is estimated. We have not read the compendium.
Status flag: Ministry of Tourism data (India Tourism Data Compendium 2026) as reported by The Policy Edge on 28 Sept 2026. Visits are not unique people. The Kumbh effect is not isolated in the data.
- The Policy Edge, 'Domestic tourism surges in 2025 but foreign arrivals and earnings fall', 28 September 2026 (India Tourism Data Compendium 2026, Ministry of Tourism).
- Our analysis, arithmetic and guide are original to MediaVault Global Magazine.
The Editorial Desk
Perspectives on the people, ideas and businesses shaping what comes next. The articles in this preview are illustrative samples, not reported journalism.
More from the Editorial Desk