Reading the Numbers on India's Small Businesses
A reader's guide to the main numbers on India's MSME sector, what they measure, where they come from and how to use them without misreading them.
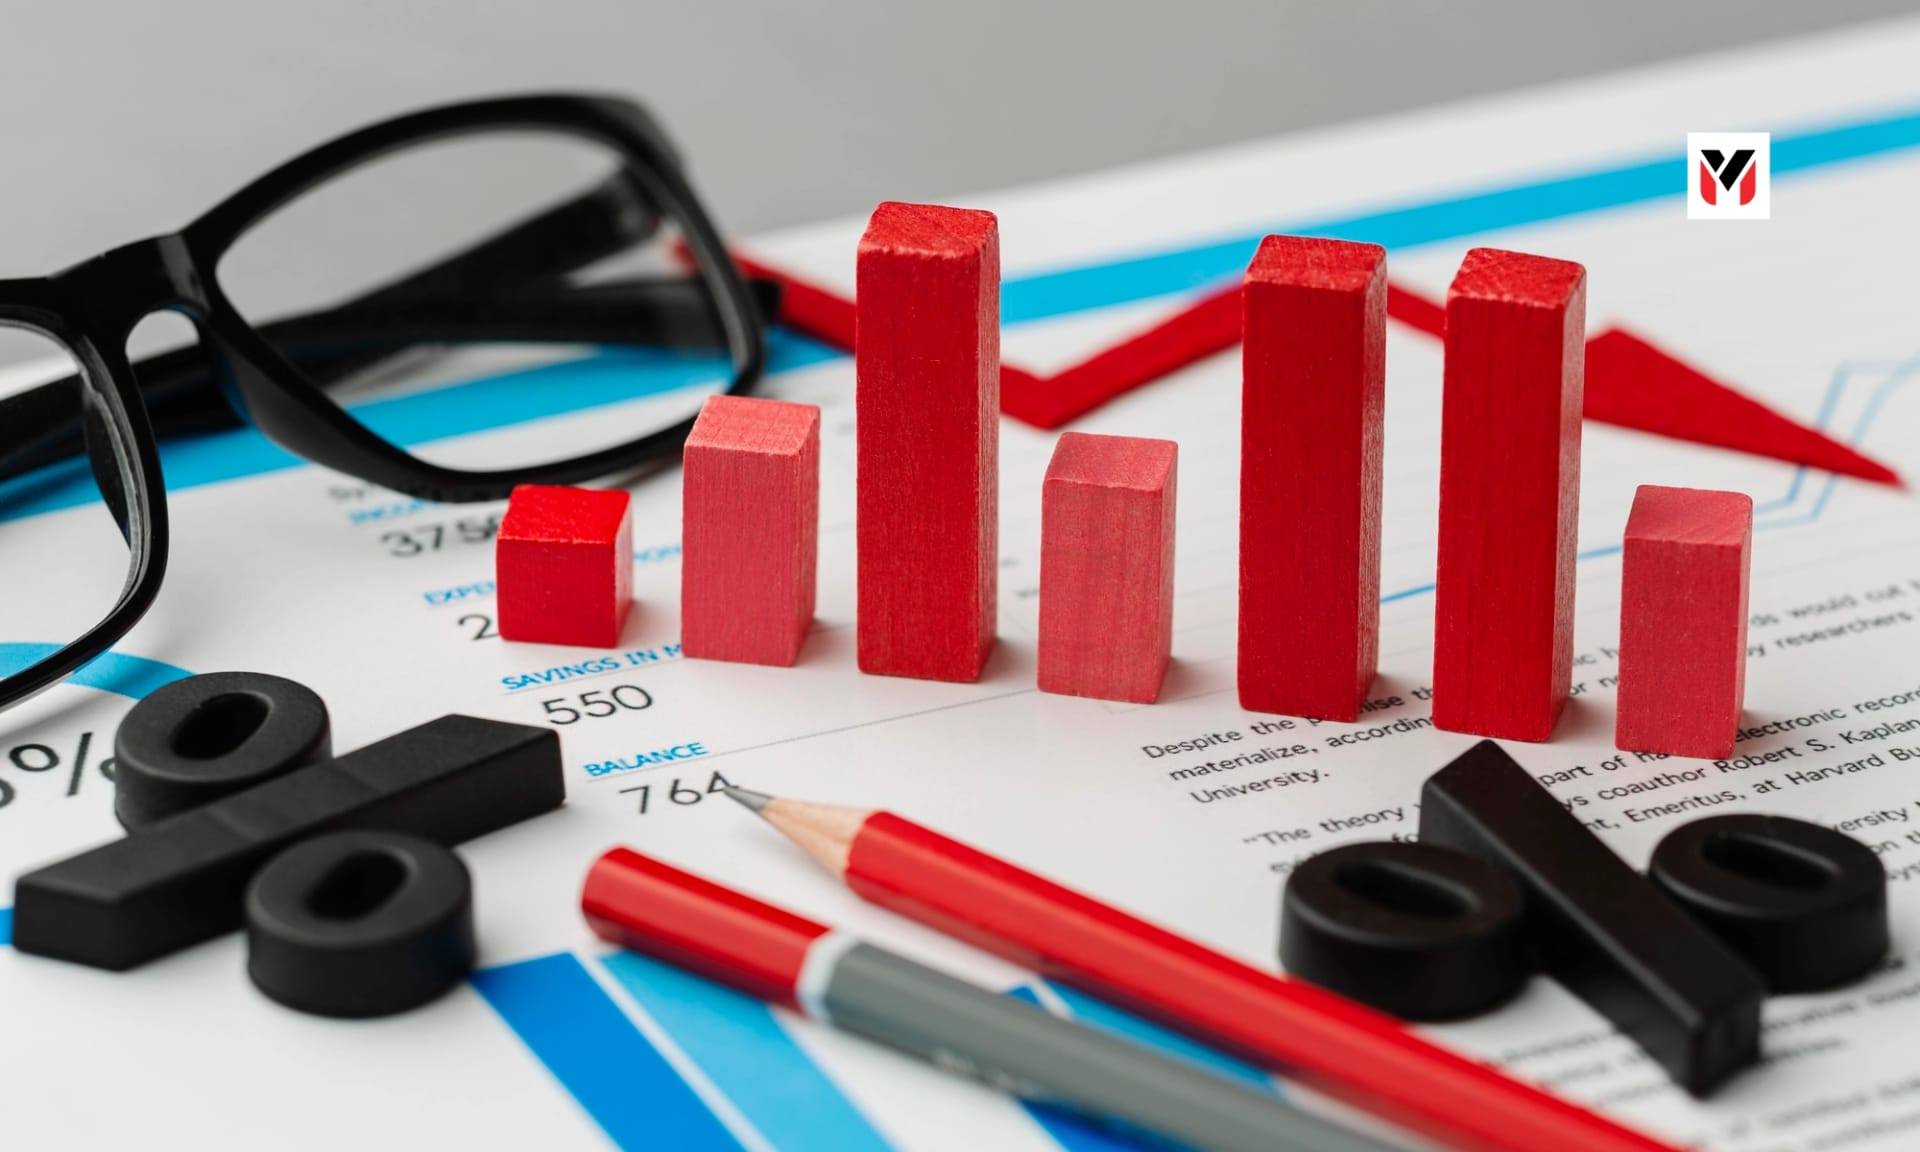
Clean bar chart on a charcoal background with a red accent · Editorial preview.
The Headline Metrics
Understanding the Indian MSME sector begins with looking at the reported metrics:
- Share of India's exports: about 48.58% (Government data cited in recent reporting. [VERIFY year]) - Share of manufacturing output: about 35.4% [VERIFY] - Udyam registrations: around 8.7 crore (Note: Registrations are not active units. [VERIFY current total]) - Logistics cost: about 8% of GDP (Hedged; official and NCAER assessment) - TReDS financing: ₹40,000 crore (FY22) to ₹3.47 lakh crore (FY26) (Public reporting of platform data)
How to Read the Numbers
Always check the denominator: 'Share of exports' can include indirect supplies.
Registration is not activity: The large Udyam number includes many tiny and informal units newly formalised.
Note the year: Government releases lag.
Compare sources: Ministry data, RBI studies and industry surveys use different definitions.
“Registration is not activity.”
Where to Find Primary Data
Where to find primary data: Ministry of MSME annual report; PIB; RBI; NSSO surveys; TReDS platform dashboards.
- All figures from earlier research; confirm and link before publishing.
- Ministry of MSME annual report; PIB; RBI; NSSO surveys; TReDS platform dashboards.
The Editorial Desk
Perspectives on the people, ideas and businesses shaping what comes next. The articles in this preview are illustrative samples, not reported journalism.
More from the Editorial Desk