Faster, Bigger, Deeper in the Red: Zepto's FY26 as a Case in Scale
The company's revenue grew several-fold in two years. The cost to deliver an order hardly changed.
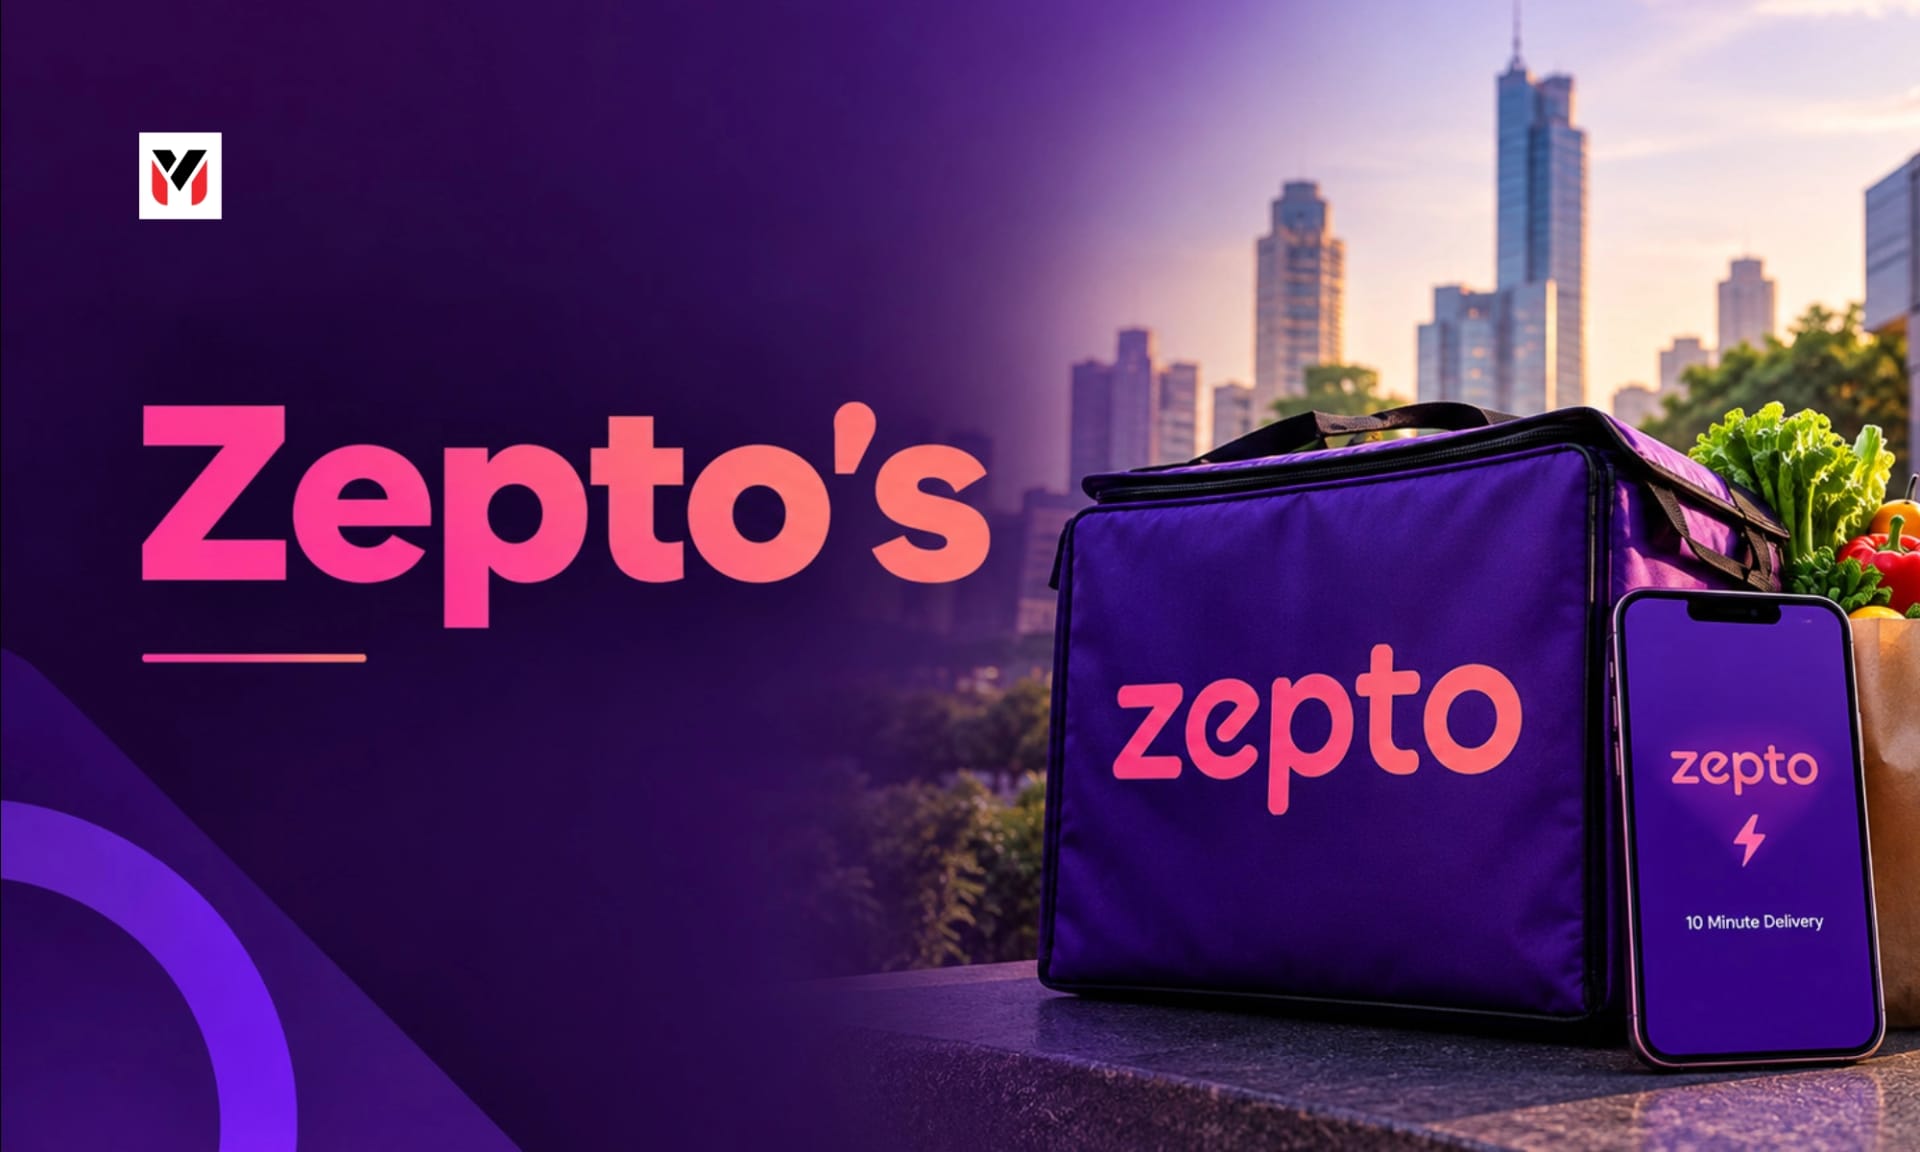
Zepto FY26 quick commerce economics case study illustration · Editorial preview.
The Situation & Financial Disclosures
Zepto is a quick-commerce company delivering groceries and other goods from local dark stores. Inc42 reported in August 2026, from the company's filings made for a proposed listing, that operating revenue in FY26 was Rs 22,623.58 crore, total expenditure Rs 29,026.75 crore, and net loss after exceptional items Rs 5,905.19 crore, against Rs 4,699.71 crore in FY25 and Rs 1,214.79 crore in FY24.
The numbers: • Sales of traded goods were Rs 17,587.92 crore, 77.7% of operating revenue. Services revenue was Rs 5,022.52 crore, 22.2%, up from Rs 547.61 crore in FY24. Within services, warehousing, packaging and last-mile fees were Rs 2,779.84 crore and advertising Rs 1,635.73 crore. • The cost of goods purchased was Rs 18,484.98 crore. Delivery and handling cost Rs 3,046.34 crore, warehousing Rs 2,149.85 crore, employee benefits Rs 1,784.67 crore and advertising Rs 1,389.12 crore. • Inc42's calculation: after adjusting for inventory change, net cost of goods exceeded traded-goods sales by about Rs 610 crore. • Delivery cost per order was Rs 42.05 in FY24, Rs 45.80 in FY25 and Rs 45.74 in FY26. As a share of revenue it was 13.04%, 14.39% and 13.47%. Monthly active delivery partners rose to 221,667. Orders reached 23.3 lakh a day in the March 2026 quarter. • Dark stores at the end of FY26: 1,139. The draft prospectus proposed about 750 new stores over two years, roughly a 66% expansion; analysts estimated cash burn at about Rs 16 billion a quarter and a runway of three to three and a half quarters assuming no major store additions, according to the article. These are analysts' estimates.
Our Arithmetic & Dark Store Unit Economics
Our arithmetic: The loss is 26.1% of operating revenue (5,905.19 / 22,623.58). The FY26 loss is about 26% larger than FY25 (5,905.19 / 4,699.71 = 1.257). Traded-goods sales in FY26 were about 4.5 times those of FY24, per the filings as read by Inc42, so the loss grew while the base grew several-fold.
What the model is: Customers order from an app. A rider delivers from a nearby dark store, which holds inventory. Money comes from the margin on goods sold, delivery or handling fees, and from advertising and platform fees charged to brands. Money goes out for goods, stores, riders, and technology. The business needs enough orders per store to cover the store's fixed costs.
“Scale showed up in revenue. It did not show up in the cost of a delivery.”
What Scaled and What Remained Rigid
What worked, on the evidence: Revenue grew several times in two years. Services revenue grew from a small share to about one-fifth. The company reached high daily order volumes. Delivery partners and stores expanded.
What did not, so far: The cost of delivery per order did not fall: Rs 45.74 in FY26 against Rs 42.05 in FY24. Inc42 observed that "the cost of putting an order in a customer's hands has not reduced by much". The gross position was reported as negative, in Inc42's calculation. Advertising net of ad spend contributed about Rs 247 crore, in Inc42's estimate, small against the loss. A new labour-code levy of 1% to 2% of turnover, with limits, was estimated by Inc42 at Rs 226 to Rs 452 crore at the lower end.
Strategic Lessons for Growth Businesses
Lessons: • Check the margin on the goods first. A negative position before delivery cannot be fixed by operations alone. • Scale shows up in some costs, not others. Delivery cost per order was flat; other lines may behave differently. • A listing is a deadline. It brings capital and scrutiny. • Know your regulatory exposure.
Discussion Questions & Local Grocer Exercise
Discussion questions: 1. If you were advising the company, which single metric would you track weekly? 2. What would have to be true for the services revenue to carry the economics? 3. How should a company decide how many new stores to open given the burn?
At your scale: an exercise (invented numbers): An invented neighbourhood grocer, Nearby Basket, delivers 100 orders a day. Average basket Rs 500, product margin 15% (Rs 75), delivery cost Rs 45, packaging Rs 5. Contribution per order is Rs 75 − 45 − 5 = Rs 25, so Rs 2,500 a day. Fixed costs (rent, staff, app) are Rs 3,000 a day. The business loses Rs 500 a day. To break even it needs 120 orders a day at the same contribution, or a product margin of 16% on the same basket (Rs 80 − 50 = Rs 30 per order; 100 orders give Rs 3,000). The numbers are invented. The exercise shows that either more orders or a better margin per order fixes the loss, and that which one is easier depends on the market.
What we do not know: We do not know the audited numbers, whether the listing will proceed, or how store-level economics differ by city and maturity.
Status flag: Based on Inc42's reading of Zepto's filings (Aug 2026), as reported in MVG-22. Calculations by Inc42 are labelled as theirs. The IPO is a developing story and must be re-checked before publication. Not investment advice.
- Inc42, reading of Zepto's FY26 filings, August 2026 (as reported in MVG-22, SC1 and SC2).
- MediaVault Global Magazine, MVG-22 (Startups › Scaling) and MVG-40 (OP6).
- Our analysis, arithmetic and exercise are original to MediaVault Global Magazine. Nearby Basket and its figures are invented.
The Editorial Desk
Perspectives on the people, ideas and businesses shaping what comes next. The articles in this preview are illustrative samples, not reported journalism.
More from the Editorial Desk